Simple and powerful Java metrics with... Metrics
2015-01-06You’re aware that part of your application is performing poorly and you need to find out exactly what and where, fast. So what do you do? You whack in a few System.currentTimeMillis(); calls, subtract the difference and do some conversions, right? WRONG. Give yourself a clip over the ears. And then go and check out Metrics.
Metrics is a Java library which gives you unparalleled insight into what your code does in production.
Metrics provides a powerful toolkit of ways to measure the behavior of critical components in your production environment.
With modules for common libraries like Jetty, Logback, Log4j, Apache HttpClient, Ehcache, JDBI, Jersey and reporting backends like Ganglia and Graphite, Metrics provides you with full-stack visibility.
Metrics has pretty decent getting started documentation with the most common project setups, so there’s no point in reproducing that here. But I will elaborate a little on how I used Metrics to gain a lot of insight for very little effort in a project I’m currently working on. Bear with me, this will literally take less than a minute…
First, you’ve got to include the metrics-core library in your application. If you’re using Maven, this goes a little something like this:
<dependencies>
    <dependency>
        <groupId>io.dropwizard.metrics</groupId>
        <artifactId>metrics-core</artifactId>
        <version>${metrics.version}</version>
    </dependency>
</dependencies>
I was using Spring (old style) so I declared a bean for the MetricRegistry.
<bean class="com.codahale.metrics.MetricRegistry" />
And inject it into the class where the problem is.
@Autowired
private MetricRegistry registry;
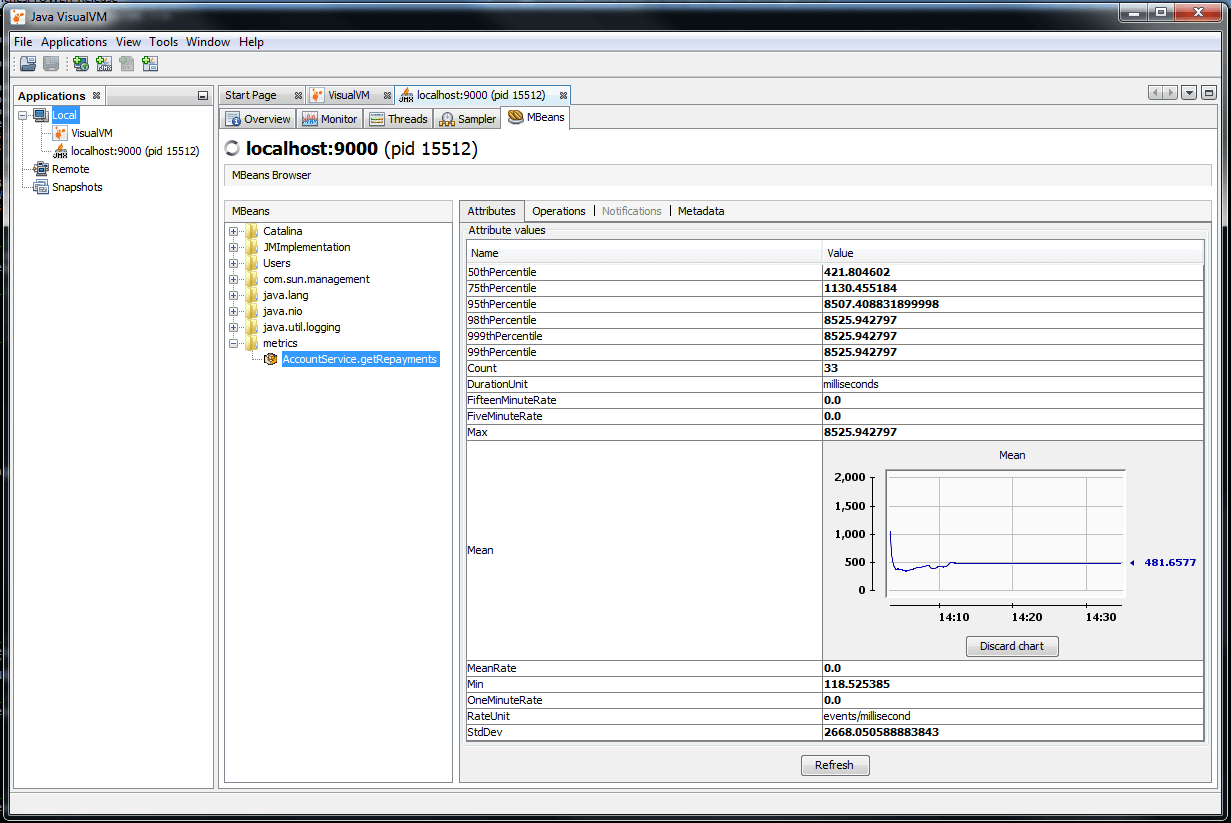
I’m using a JMX Reporter to pull out my metrics, so I set up the reporter in a @PostConstruct intialiser.
@PostConstruct
public void initMetrics() {
    reporter = JmxReporter.forRegistry(registry)
            .convertRatesTo(TimeUnit.MILLISECONDS)
            .convertDurationsTo(TimeUnit.MILLISECONDS)
            .build();
    reporter.start();
}
Finally, I used a simple timer to record execution time of the method(s) where the problem lies:
Timer.Context timer = registry.timer(name("AccountService", "getRepayments")).time();
// code you're timing goes here
timer.stop();
Simple or what?!
Once you’re application is up and running, and as long as you have remote JMX management enabled on your application server/container, you will be able to see all the information that Metrics produces using a tool like VisualVM (run jvisualvm from your shell).
There are whole bunch of features that Metrics provides right out of the box like Gauges, Counters, Histograms, Timers, and Health Checks, and various reporting mechanisms. Metrics is a great place to start learning about and implementing some metrics gathering in your applications.
Your thoughts? I'd love to hear them. Please get in contact.